Automate your energy data collection, analysis, and reporting


Take control of your energy data at scale
-
Data Normalization
Automatically normalize data against weather or occupancy changes to compare building performance across locations.

-
Performance Benchmarking
Identify opportunities to optimize resource consumption by analyzing common building- or portfolio-level data points.

-
Real-Time Alerts and Notifications
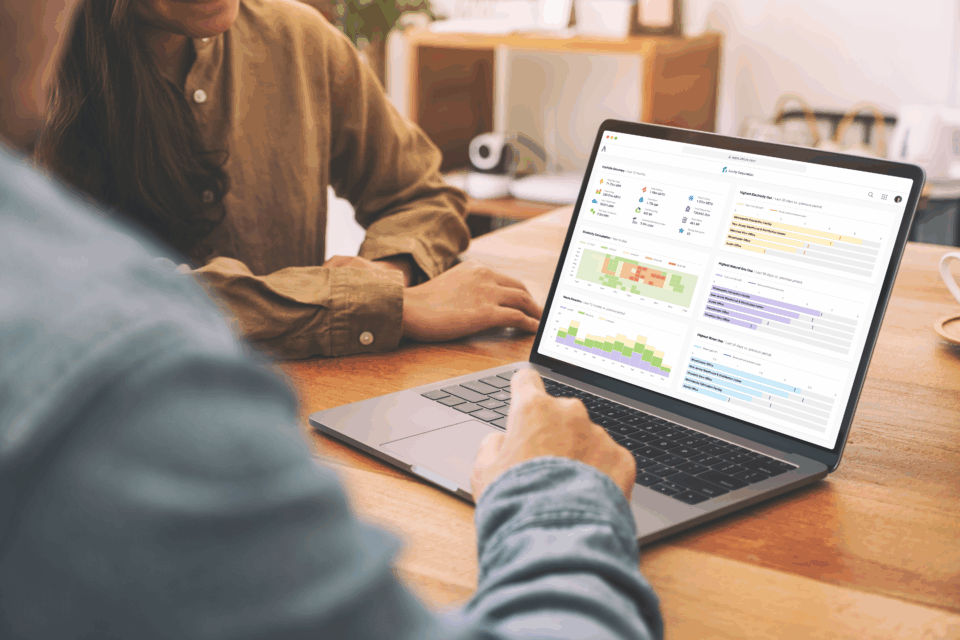
Monitor resource utilization with campus-wide and building-specific load profile analysis, clear charts, and accurate energy thresholds.
-
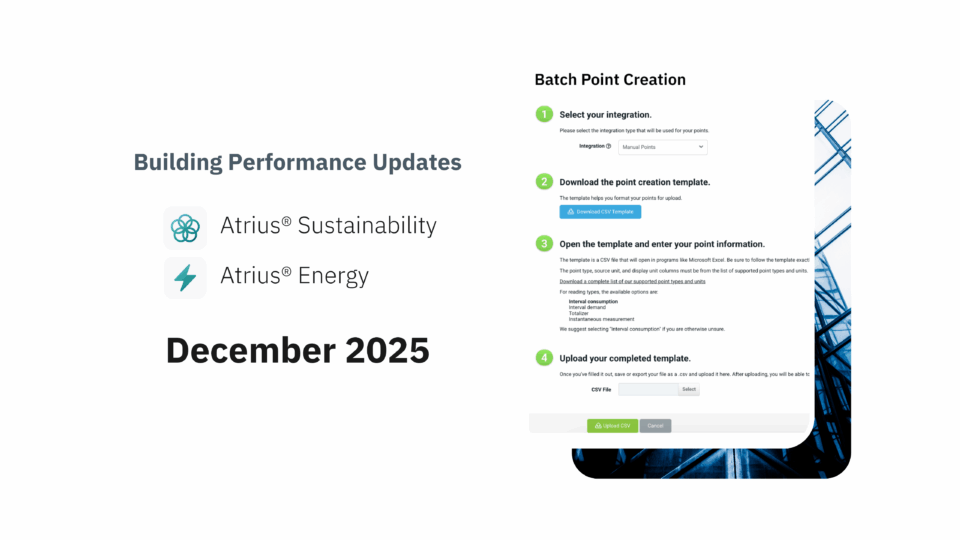
Integrations
Consolidate utility-, meter-, sensor-, and building-level data from disparate sources into a single platform.


“Weber State has saved over $2.3 million since 2020 using Atrius® to identify, scope, and verify energy projects.”
Justin Owen, Energy Manager, Weber State University
View Case StudyCentralize building performance data across your portfolio
Effortlessly track capital projects and return on investment
-
Industry-Leading Measurement & Verification
Verify the results of energy efficiency investments using industry standard IPMVP Option B or C.

-
Project Baselines
Set baselines for temperature, humidity, heating, or cooling degree days (HDD and CDD) and occupancy.
-
Real-Time Tracking
Benchmark energy and resource use before and after a project takes place to track changes and monitor differences in real-time.

-
Localization
Track each facility’s progress with organizational-wide defaults for currency, utility bills, language, and date & measurement formats.
Learn more
Share your energy reduction efforts with stakeholders
-
Engaging Storyboards
Encourage occupants to reduce energy consumption by sharing dynamic storyboards across public screens.
Learn more
-
Visually Intuitive Dashboards
Easily build and share dashboards for aggregated greenhouse gas emissions, energy consumption, utility bills, and additional critical data.
Learn more
-
Automated Reporting and Compliance
Report benchmarking data in the form of monthly Energy Star Portfolio Manager scores and ensure compliance with the new ASHRAE 90.1 2019 - IECC 2021 section C405 legislation that requires energy dashboards that monitor end-use submeters.
Real-time energy performance visibility

“Atrius makes energy and emissions data readily accessible to faculty, students, and consultants who appreciate the intuitive, user-friendly format.”
Martha M. Larson, CEM, Energy & Sustainability Manager, Carleton College
Ready for a deeper dive?
Browse success stories and articles from industry thought leaders on energy and facilities management, sustainability, and building performance.