During conversations with energy managers, facility managers, and other professionals in the buildings industry, Economical and sustainable energy management requires a clear understanding of the difference between electricity demand and consumption. Knowing how your utility provider measures and bills electricity is crucial to reducing costs without negatively impacting operations or occupant comfort.
Defining Demand vs. Consumption
Electricity demand is measured in kilowatts (kW) and represents the rate at which electricity is used.
Electricity consumption, on the other hand, is measured in kilowatt-hours (kWh) and represents the amount of electricity used over a certain time.
Let’s start with the familiar analogy of driving a car to explain further. The rate at which a building consumes energy, or the facility’s demand (kW), equates to the car’s speed (mph). And the energy consumption (kWh) is like the total distance driven (miles).
Total driving distance and total energy consumption are calculated the same way: in the car, multiply the average speed by the number of hours driven to determine distance driven; for energy usage, multiply demand by time in use and you get total energy consumption.
With our imaginary car turned off, here’s the difference between demand and consumption in the real energy world. When turned on, the 10W LED light always demands 10 W from the grid. However, energy consumption varies according to the number of hours the light is used. If the LED is on for 10 hours, total consumption is 10 W x 10 hours or 100 Wh; if it’s only illuminated for five hours, then you’re consuming 50 Wh.
So, while the factors measuring consumption change, the value of knowing how these calculations impact operations are constant.
Why knowing the difference between demand and consumption matters
Utility rates for commercial buildings are frequently based on the highest average demand (a.k.a, peak demand) during a specific period in the utility cycle, usually tracked in 15-minute intervals. This means if your building’s demand profile holds steady around 100 kW but surges to 200 kW for one 15-minute period, the utility bills are based on your building’s demand of 200 kW.
Why? Because the utility is ensuring they can meet your building’s peak electricity demands without compromising grid reliability. They’re charging higher rates to encourage reduced demand. Consumption billing formulas also change depending on peak usage.
Electricity consumption in commercial spaces is billed on a time-of-use pricing model and it costs more during certain times of the day. For example, during the summer, peak times are weekday afternoons between 2:00 pm and 6:00 pm. The heaviest use periods in the winter tend to be weekday mornings between 9:00 am and 12:00 pm, followed by weekday evenings between 5:00 pm and 8:00 pm. Here again, utilities are charging higher rates to hopefully reduce an organization’s overall consumption.
What’s the bottom line on all these fluctuating bills and peak period rates?
If you don’t have a bird’s eye view of how your electricity-depended systems are functioning, your utility costs are likely higher than they could be with better monitoring. Facility teams committed to reducing overall electricity usage without compromising occupant safety or comfort need to know total building consumption.
How to achieve a bird’s eye view of building performance
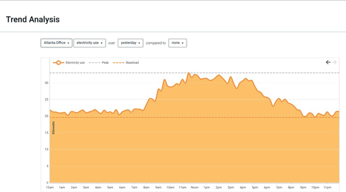
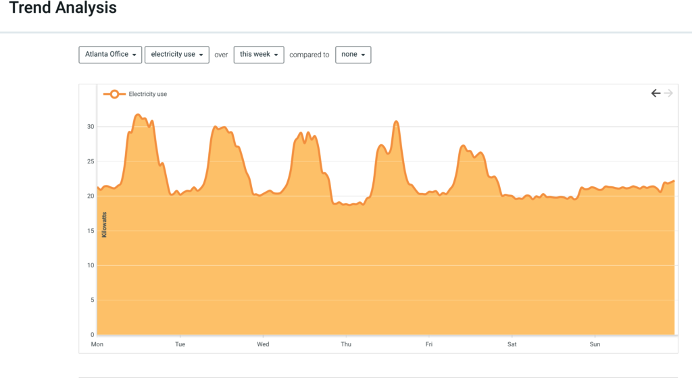
The ability to capture and monitor a building’s energy performance over a longer period is essential to identifying demand and consumption needs. Below, we’ve detailed our Atrius Building Insights Trend Analysis app that displays a single day or one weeks’ worth of real-time data. With this information, teams are better able to understand their total building’s performance and pinpoint areas of improvement.
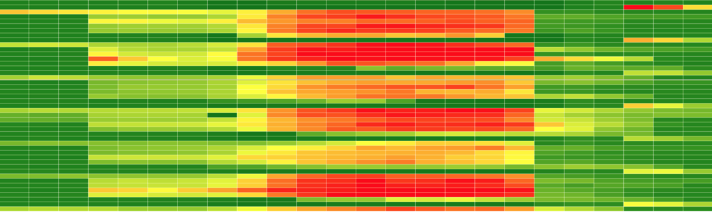
Daily:
Isolating these trends and peak requirements is the first step to decreasing electricity costs by reducing or shifting demand to different time periods. Knowing how consumption levels vary by day or week means you can potentially lower consumption by pinpointing which end-uses (e.g., HVAC, lighting, or plug load) are likely increasing consumption at specific times.

How to reduce electricity demand in commercial spaces
Scheduling optimal performance levels for your utility systems is a good starting point to better manage demand and consumption. Unfortunately, it’s not foolproof.
Building usage can change unexpectedly or occupancy levels could fluctuate with severe weather. Failure to adjust previously established scheduling can suddenly and negatively impact energy budgets, comfort conditions, equipment longevity, and your ability to meet performance standards or service-level agreements (SLAs).
Building Insights functions accelerate your ability to identify buildings or systems with potentially errant scheduling and the extent of these deviations. Reducing lighting and HVAC operating times while maintaining occupant comfort and saving money is just one strategy to reduce electricity demand in your commercial spaces.
Using Atrius Building Insights to identity top-consuming buildings
If you manage multiple buildings, then a campus- or portfolio-wide comparison can provide a useful view of the top-consuming buildings and where to find potential savings.
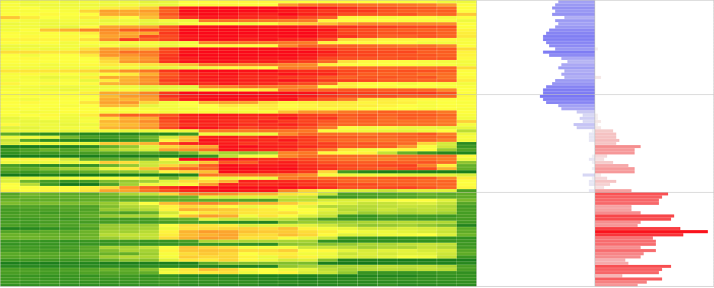
Building Insights’ Portfolio Drift app shows how individual buildings contribute to portfolio performance—and how they “drift” over time. The graph displays the quantity of a metric via the size of a cell and percentage change from the previous period via the color of a cell.
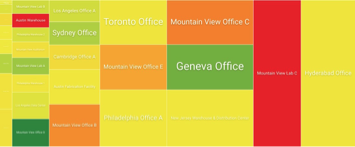
Alternatively, the Comparisons app within Atrius Building Insights shows simple ranked comparison of buildings according to total cost or consumption. These visualizations help you prioritize buildings schedules analysis.
Questions to ask when using data to develop building schedules
Here are several key questions to ask in order to better inform building schedules.
Is time-of-day scheduling in place?
Time-of-day scheduling ensures a building curtails usage during partially occupied periods and shuts down during unoccupied periods. If properly scheduled, nightly setbacks should also recede during the morning hours to meet building demands during the day.
Is day-of-week scheduling in place?
Day-of-week scheduling ensures that a building curtails usage on partially occupied days and shuts down on unoccupied days, such as weekends and holidays. Depending on building type, higher or lower baseloads may be observed, regardless of occupancy. For instance, a grocery store will always have 24/7 refrigeration requirements.

Are seasonally adjusted temperature setpoints in place?
Building automation systems should be programmed to respond to seasonal variations in temperature. For a building with electric cooling and gas heating, there should be a correlation between higher electricity consumption and cooling degree days during warmer months. Conversely, cooler months should show a correlation between lower electricity consumption and heating degree days.
Have temporary overrides been reverted to typical settings?
Temporary overrides are commonly implemented to accommodate special situations, such as an event or after-hours maintenance. Overrides should usually be set according to expected building occupancy levels during those times. Most importantly, you should revert them to the prior scheduling settings as soon as possible when they’re no longer needed.

Are new systems and equipment properly commissioned?
New equipment often requires an extensive commissioning process, particularly if it is introduced into an existing building system. Evaluate building scheduling before and soon after any equipment maintenance or replacement.

Does system or equipment performance merit maintenance or replacement?
Malfunctions can lead to more than just comfort complaints—they can drastically reduce the equipment’s useful life. For instance, if an HVAC unit appears to be “short cycling” in rapid succession, there might be other undetected problems, such as broken sensors or leaky valves. If left unchecked, costly equipment failure is possible.