The most forward-thinking companies across industries are increasing investments to understand their energy consumption, carbon footprint, and opportunities to combat climate change. Atrius® software centralizes data from disparate platforms to give management, facilities, energy, and sustainability teams an actionable view of building performance. Below we outline 4 popular use cases.
Emissions Reporting
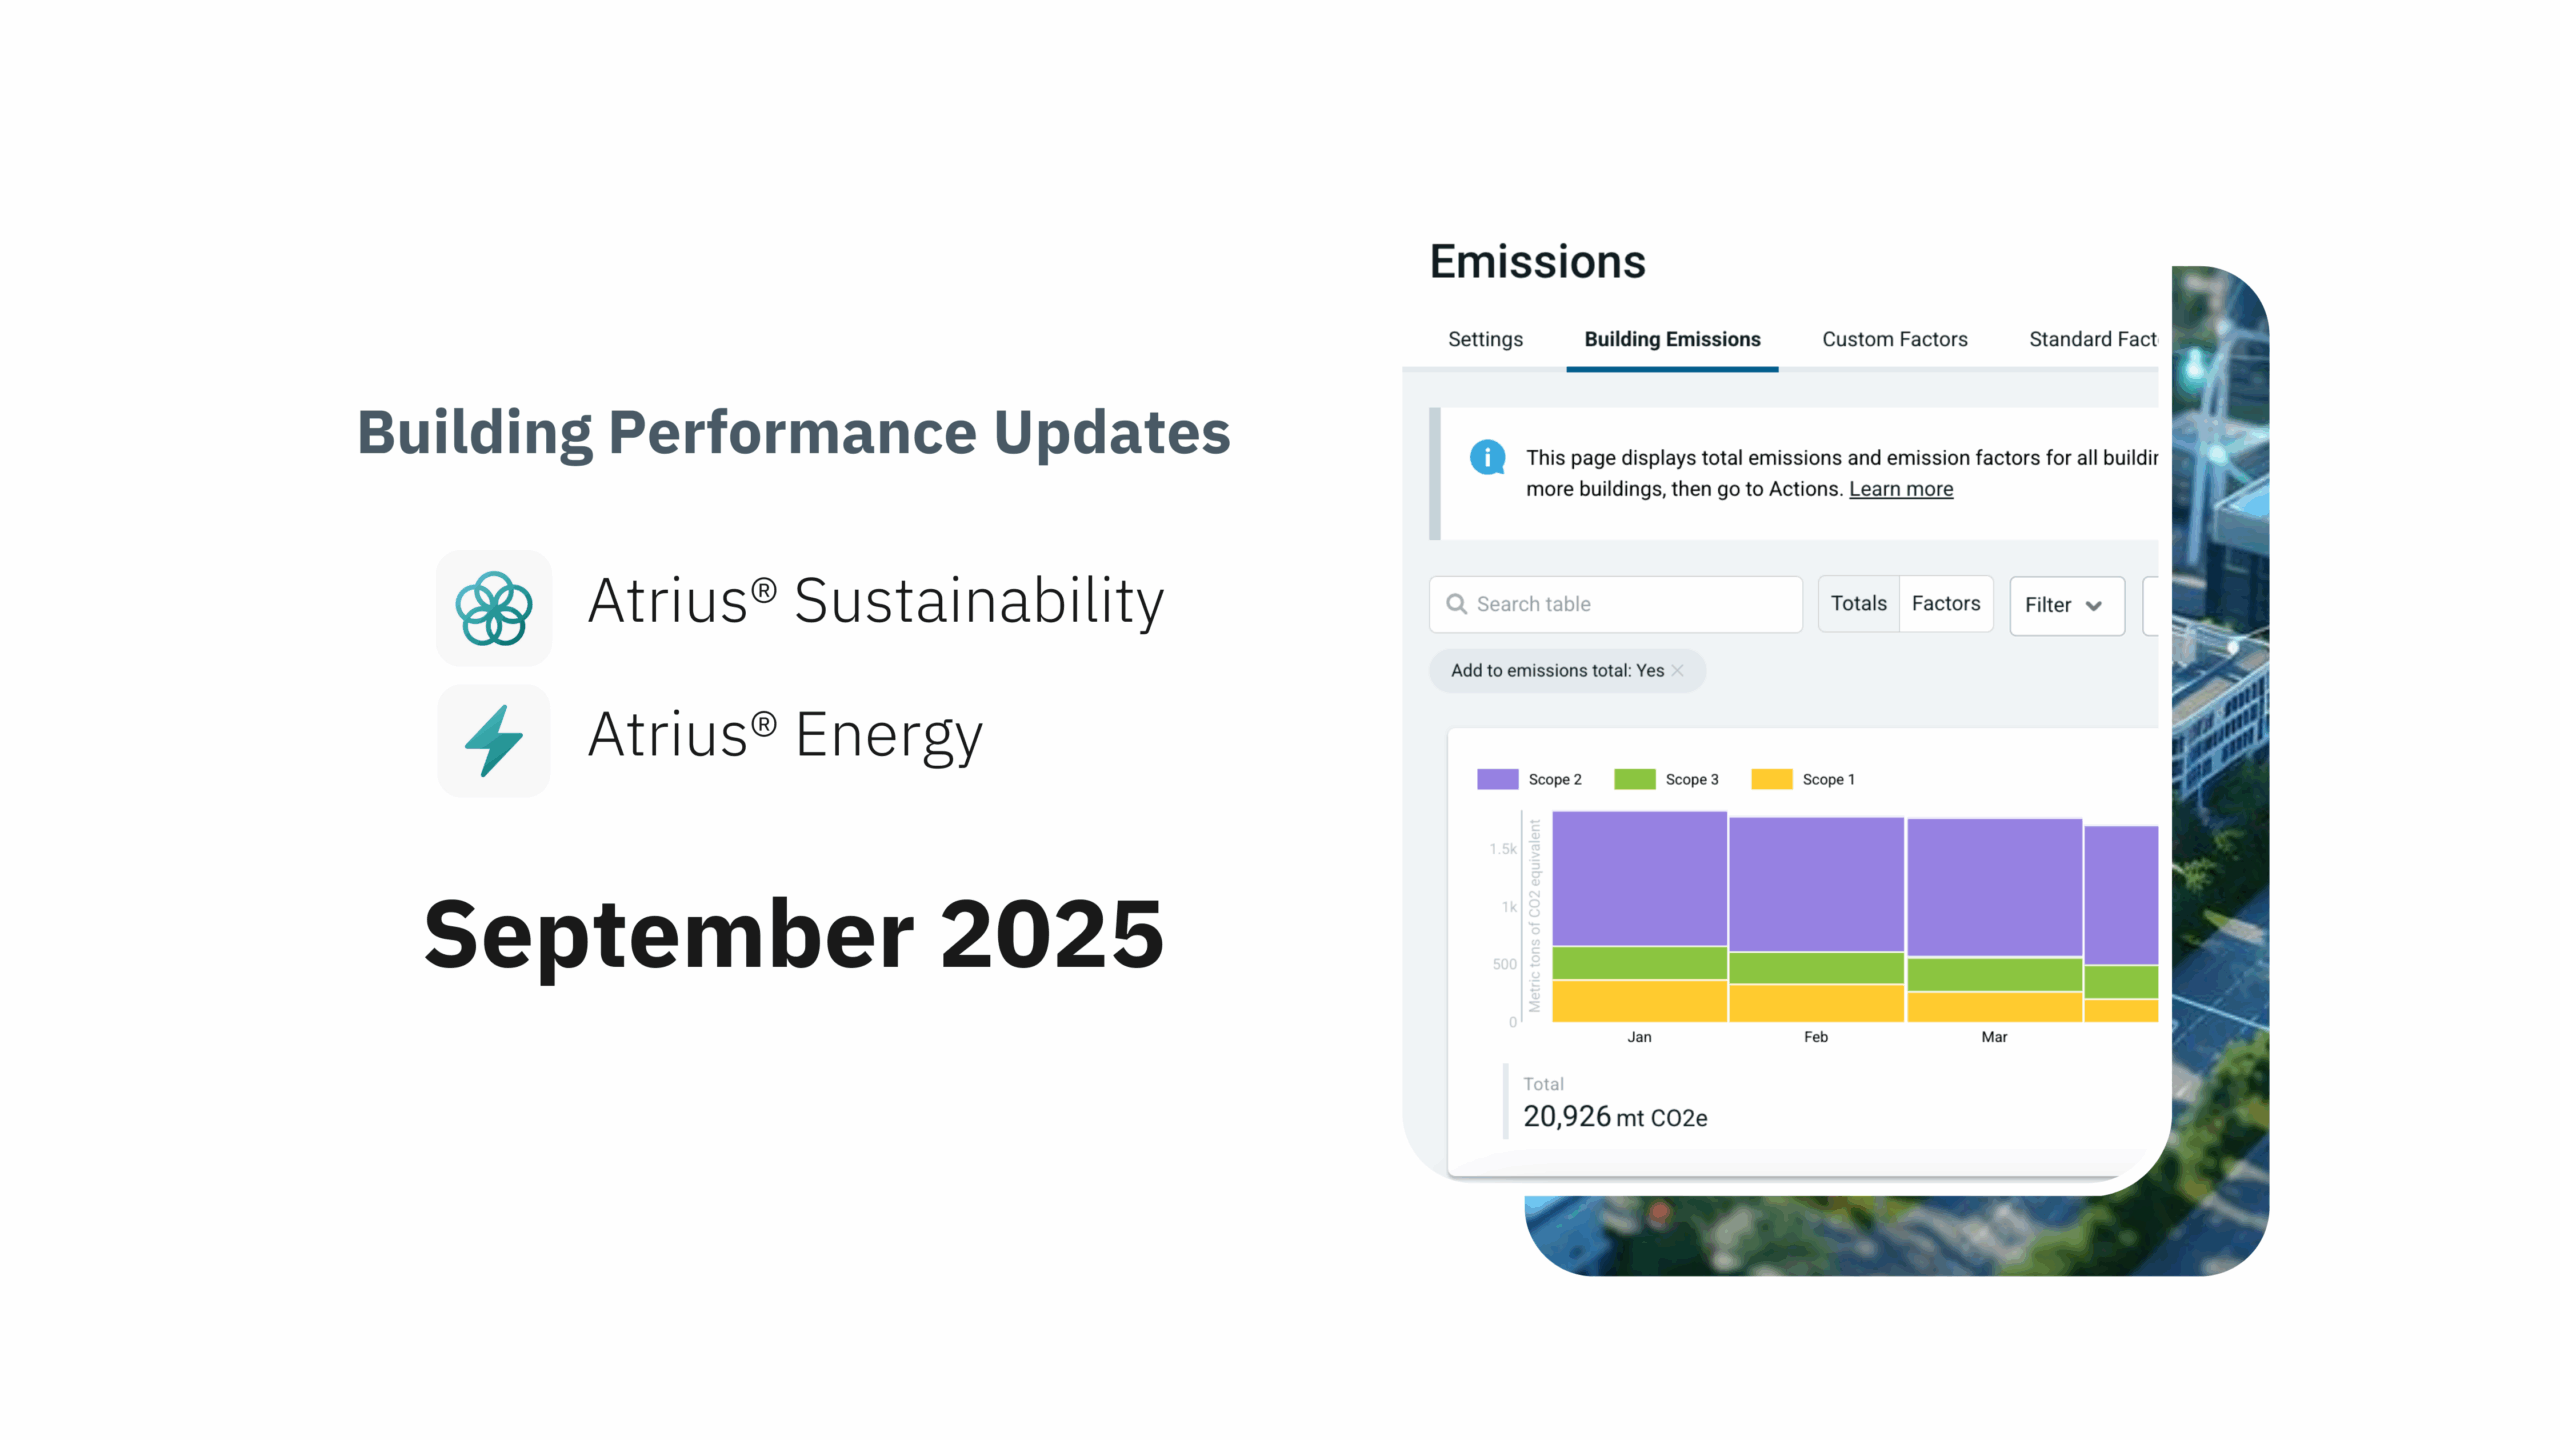
ESG reports can be cumbersome – but collecting and calculating the data is usually the hardest part. The Emissions app and customized dashboards within Atrius Sustainability simplify the process. Using the Emissions app you can:
- Manage all of the emissions data in your building portfolio
- View total resource consumption and emissions for each of your buildings, data types, and by Scope or Reporting category
- Validate and edit your emission factors, scope assignments, and reporting categories
- Assign multiple factors to the same data type
- Classify emissions with different scopes or reporting categories
- Leverage templated dashboards to automatically summarize data for the report of your choice
- Transfer calculated data directly to your emissions report or download it as a CSV
- Share your reports across your organization and externally in pre-built, user-friendly formats
Watch the video to learn more about our ESG Reporting, Sustainability Reporting, and Emissions features:
Dashboards
Preparing information for at-a-glance viewing or reporting to stakeholders is a quick and easy process with our dashboard framework. Using Dashboards you can:
- Build a report from scratch using our card library or leverage our template dashboards
- Choose from portfolio, building, and tenant-level analytics
- Incorporate images, text, and web elements
- Drag and drop dashboard cards, duplicate them, edit them, or delete them
- Display your data points across different metrics, chart types, and time periods
- Include overlays to compare your data to a baseline or previous period, divide by area or occupancy, and more
- Assign tags to label and group data across your portfolio
- Use tags in dashboards to quickly group subpoints and facilitate dashboard copying from building to building
- Share dashboard reports via live link, through a scheduled email
- Download an entire dashboard as an image or CSV
Watch the video to learn more about Dashboards:
Proactive Energy Management
Traditional maintenance methodology is reactive to alarms and information from different systems, leading to overwhelmed facility staff and a long list of deferred maintenance tasks. Our software eliminates the need for repetitive processes and helps managers identify problems before they arise, saving organizations from potentially costly energy events. Atrius enables building and facilities managers to:
- View real-time interval data in as granular as 1-minute intervals, which can be viewed in Data Manager for each data point, and trended and analyzed in apps and dashboards
- Explore trend analysis from 1-minute granularity up to month-by-month
- Graph interval data against historical trends and external variables
- Identify potential opportunities to optimize building resource consumption
- Quickly identify load anomalies by plotting interval data over a time series for specific days
- Create dynamic reports that actively display energy demand and consumption trends
- Display an entire year of hourly data in a single heat map to find energy efficiency and building scheduling improvement opportunities
- Evaluate appropriate thresholds and set custom alerts for individual systems and data points
- Send alert notifications to anyone in your organization
Watch the video to learn more about Proactive Energy Management:
Insights and Projects
Energy and sustainability managers are responsible for setting resource reduction targets and implementing projects to reach them. Proving ROI on these projects is critical to gain approval and investment from upper management for ongoing Energy Conservation Measures (ECMs). With Projects in you can:
- Eliminate time spent manually collecting data and designing reports to prove ROI.
- Benchmark energy and resource use before and after a project takes place.
- Track changes and monitor differences in real-time or through utility bill data trends.
- Leverage weather-integrated baselines to estimate savings in cost and consumption.
- Accommodate capital project tracking using IPMVP Option A, B, & C.
- Share energy efficiency project stories to engage occupants and stakeholders with public-facing storyboards and dashboards.
Watch the video to learn more about Projects:


