Collecting and analyzing key data points in today’s data-driven world is essential to report on your sustainability goals. When organizations generate these key data points, it can be a manual process for teams to collect and analyze data if they’re not using an automation tool. Atrius® takes away the manual energy and sustainability reporting processes, giving you more time to focus on strategic activities to meet and exceed your goals.
Save time by effectively using dashboards and eliminate manual spreadsheets
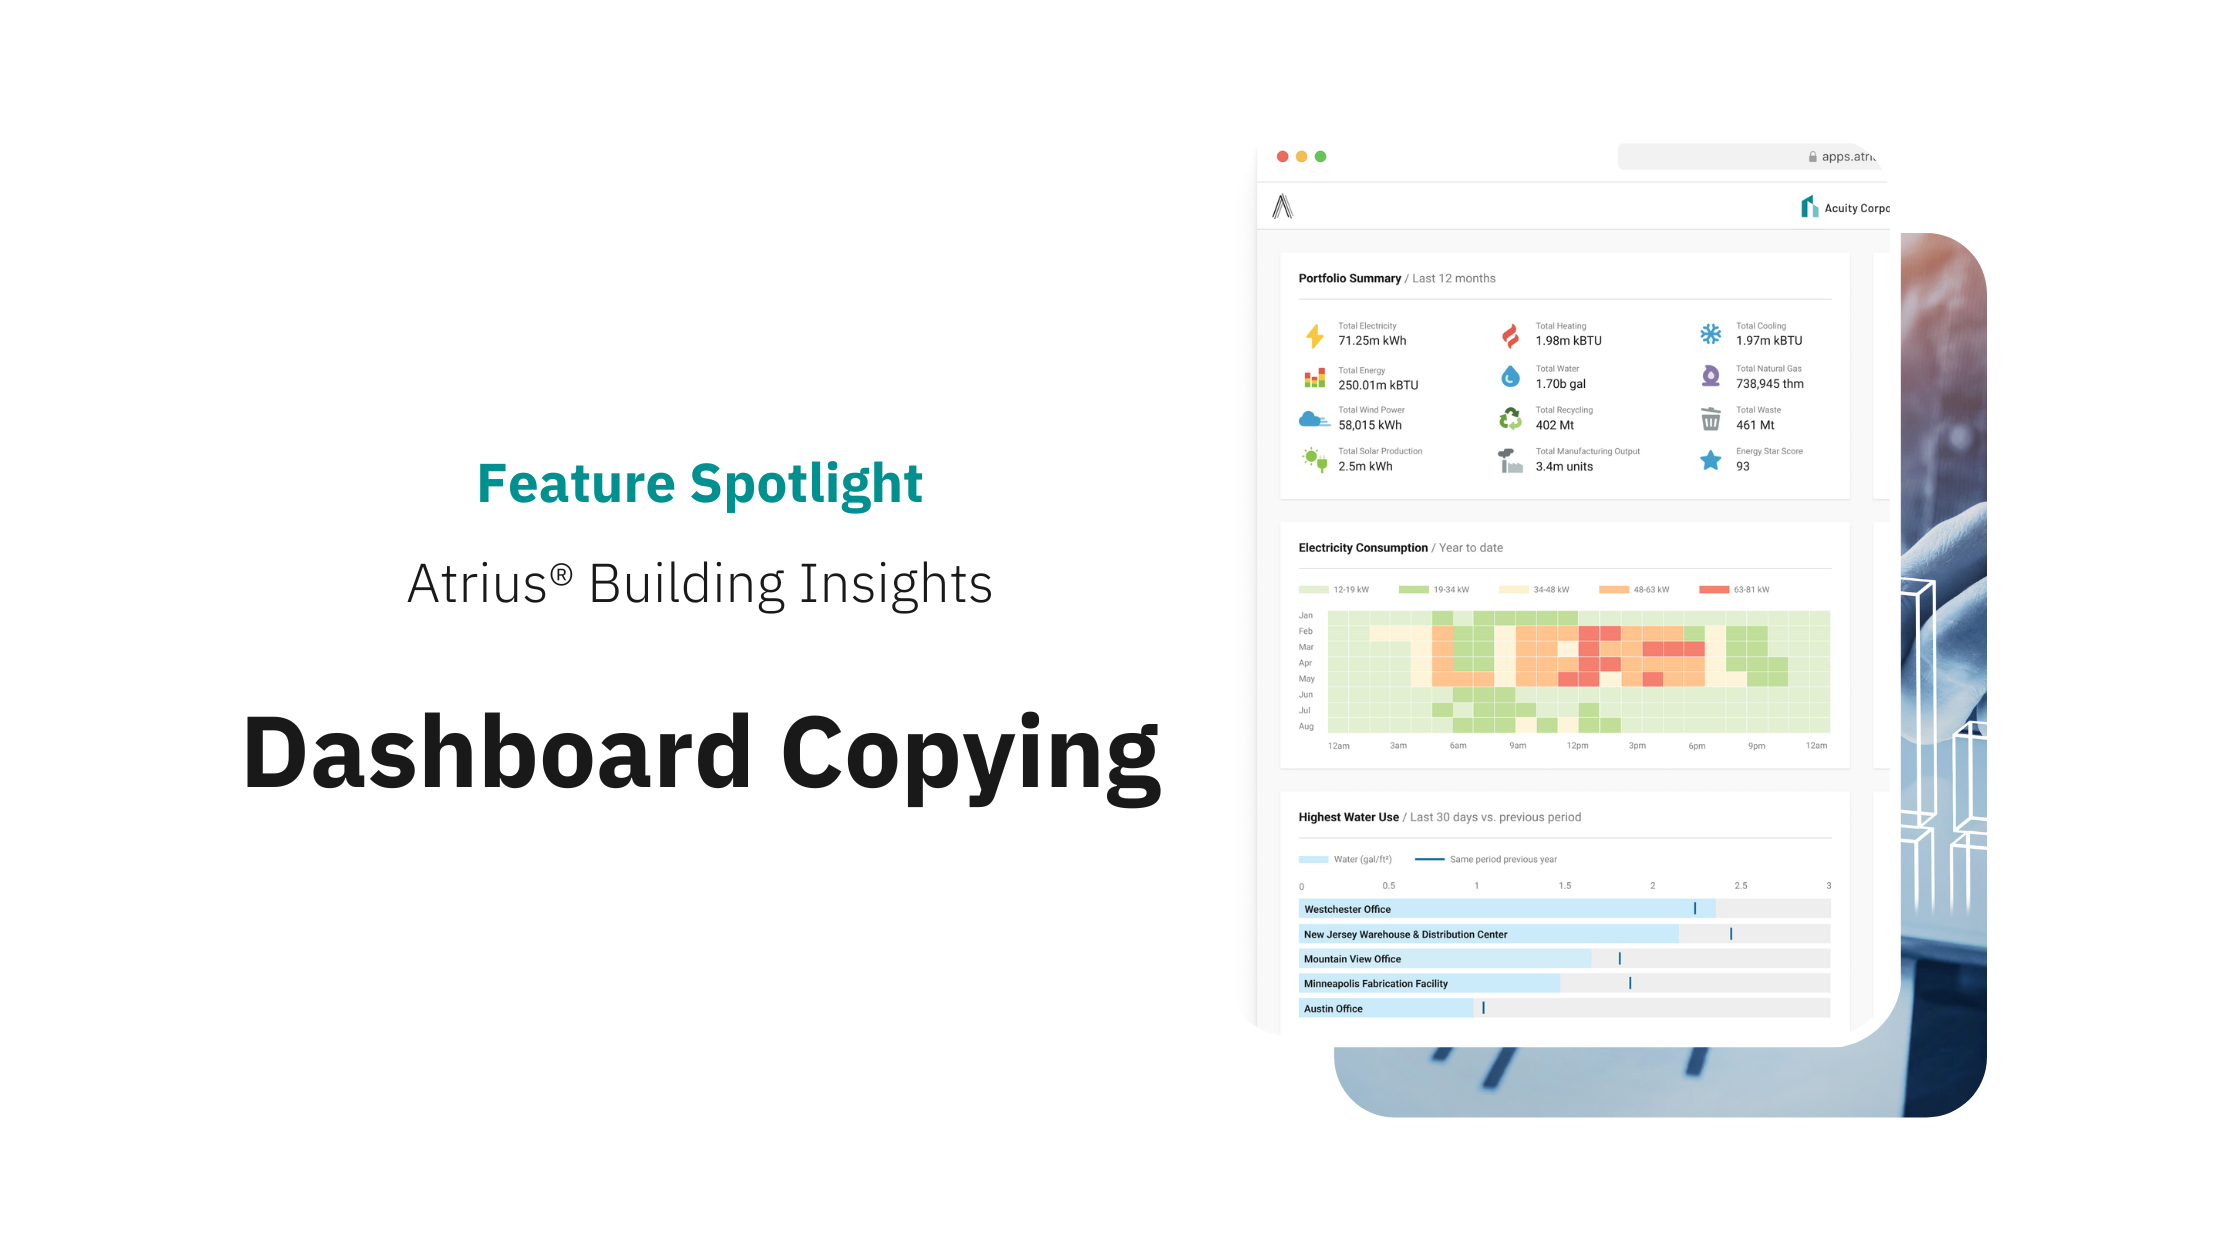
According to the 2023 State of Sustainability Report, organizations still using spreadsheets to aggregate, track, and report carbon data are wasting time and money. Utilizing dashboards provides a visual representation of key data points. It is also a valuable tool for collecting information efficiently, improving decision-making, and increasing collaboration across teams. As customers, employees, shareholders, and financial institutions continue to push for more transparent reporting around corporate sustainability initiatives, organizations face mounting pressure to ensure their data is accurate and accessible. However, creating a dashboard from manually aggregated data can be complex, and time-consuming. Aggregating data manually can also create more opportunities for human error to occur. By eliminating the manual process of copying a dashboard, the latest update below can help provide instant insights by automatically generating easy-to-read reports to share with stakeholders utilizing dashboards users already have created.

Dashboard copying is now easier and faster than ever
Dashboards help organizations centralize data collected from disparate systems like utility bills, submeters, renewable sources, IoT devices, work orders, assets, and APIs.
The latest update makes dashboard copying more effortless with just one click. With this latest update, users no longer need to spend additional time copying dashboards manually by clicking into every individual card and updating the building & points displayed. This update enables users to utilize dashboards they already have created, saving time by either copying a dashboard to one building or creating copies for all buildings in their portfolio. All card attributes that are associated with the building on your template dashboard will be matched to a destination building:
- Building
- Building groups
- Points selected on cards
Step One: Create
Follow the familiar process to create a custom building dashboard or start with a dashboard that you already use.
Step Two: Copy
Use the copying modal to select buildings in your organizations that you wish to replicate this dashboard for, or if you’re a Partner user, select buildings across your portfolio of organizations.
Step Three: Review
A copy of your template dashboard will be created for each building selected. Our software looks for data points in each of the destination buildings that match those on your template dashboard, to select the correct points to display.


